Back in the summer, we were all struck with World Cup fever and, in this post, I shared some stats and charts looking at the heights of players in the tournament.
In a few days time the Six Nations rugby tournament kicks off for another year, so I thought it appropriate to have a look at the stats of those involved.
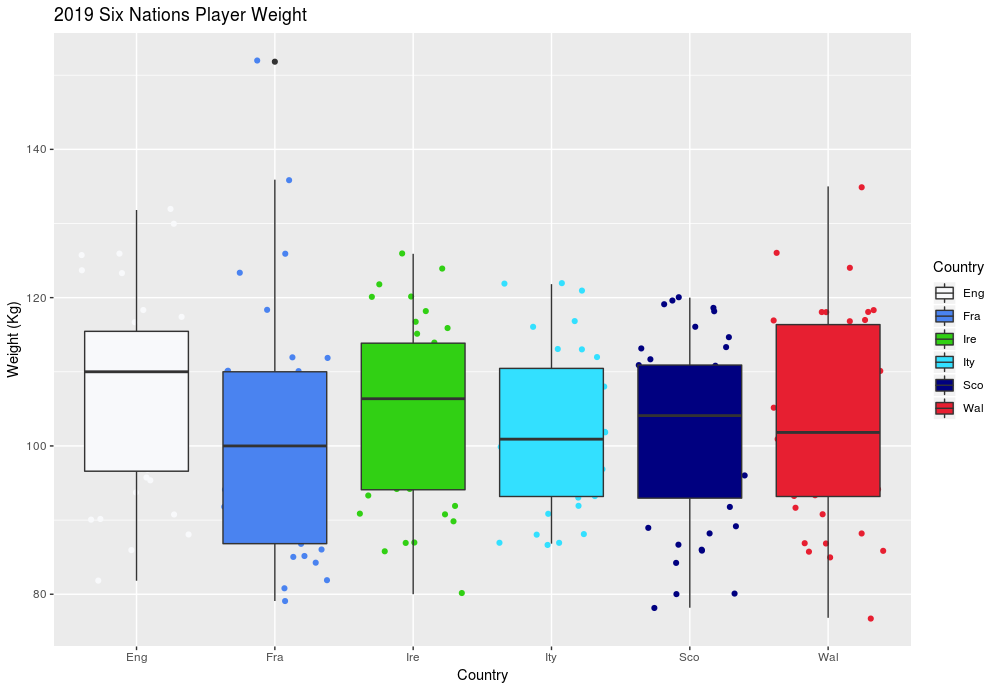
Above you can see a box plot illustrating the weights of the six squads.
[In a box plot, the line through the box is the median – or middle – value: half the players are heavier than this value, half lighter; the top of the box the upper quartile – 75% of data values (in this case, player weights) are below this line; the bottom the lower quartile – 25% of data values are above this line; the upper and whiskers lower whiskers denote data values that fall outside the middle 50%.]
The plot above suggests to me that England have the heaviest squad, France the lightest, and also the team with the greatest range of weights.
Another way to look at the weight of the squads is using density plot, below:
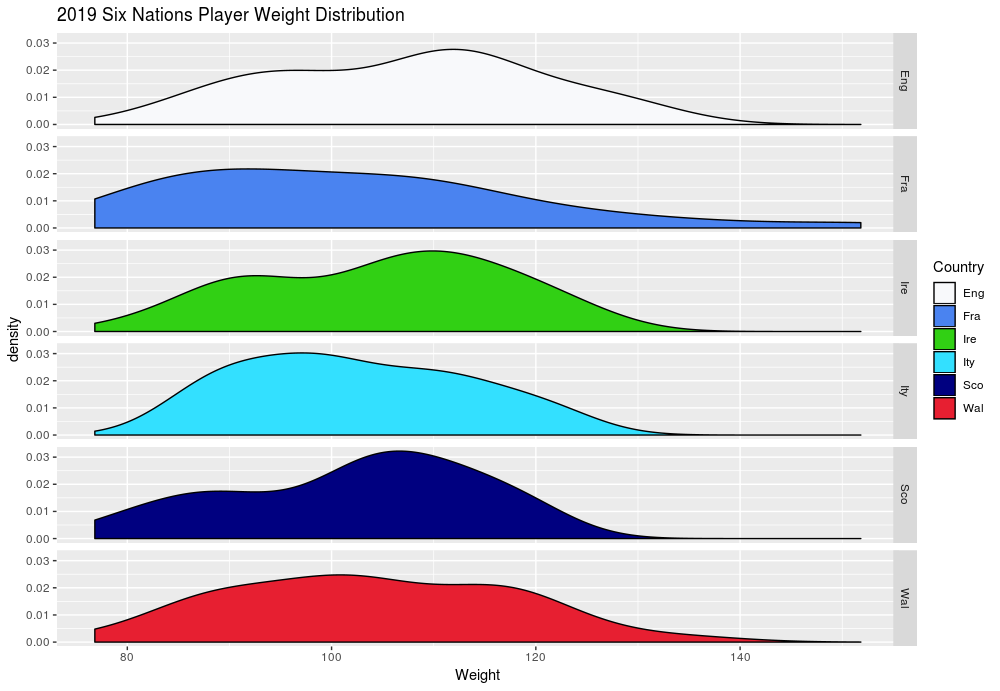
Having plotted the above, it looked like there were a couple of peaks in some of the distributions, particularly noticeable in the England, Ireland and Scotland squads. If we took a random selection of the population we world expect to see a much more smooth “normal” distribution, or bell curve.
But a rugby squad is not normal! I suspected that the weights of those who play in the scrum would be more than those in the backs. So I let the data do the talking, comparing all players taking part in the tournament by position: scrum or backs (I combined the data from all nations as to do this on a country by country basis would result in sample sizes that were too small)
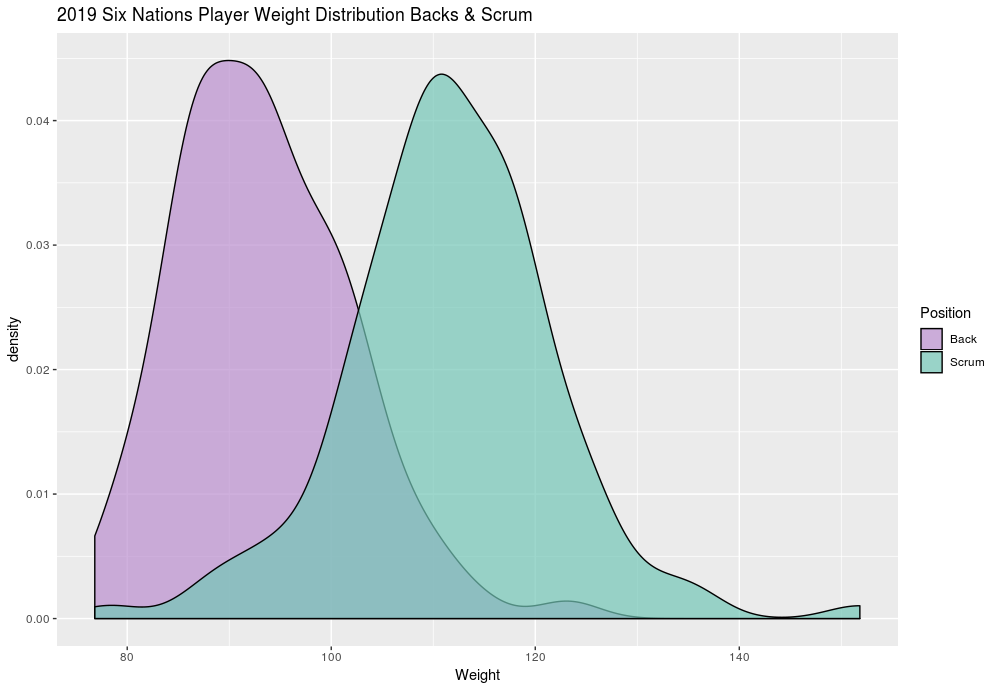
The individual distributions for the backs and scrum are fairly “normal”, but it is clear that backs tend to be lighter than those who ply their trade up front in the scrum.
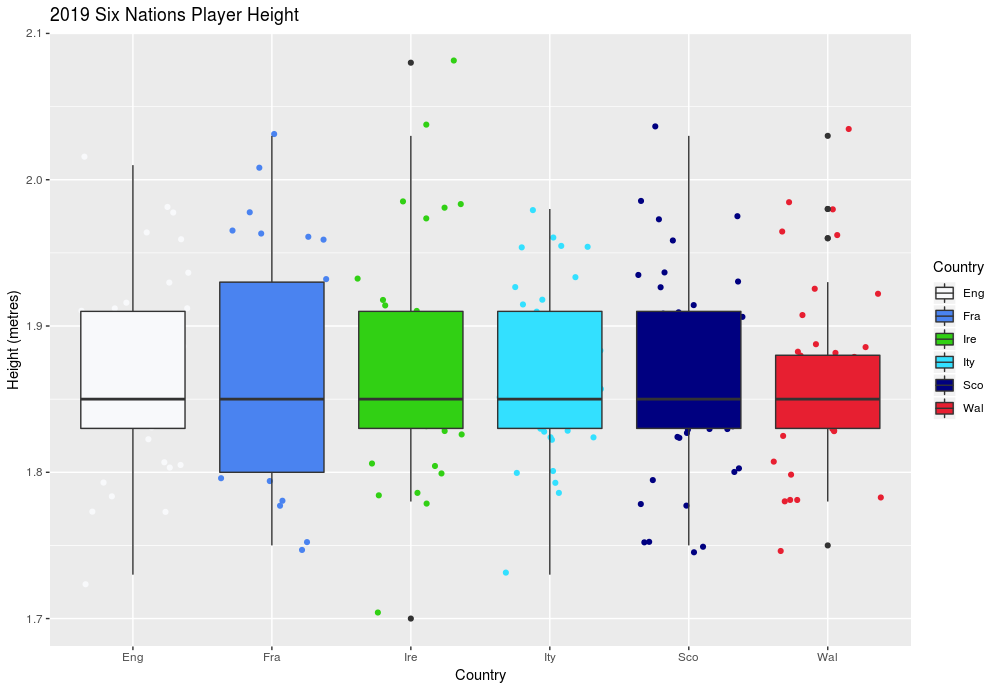
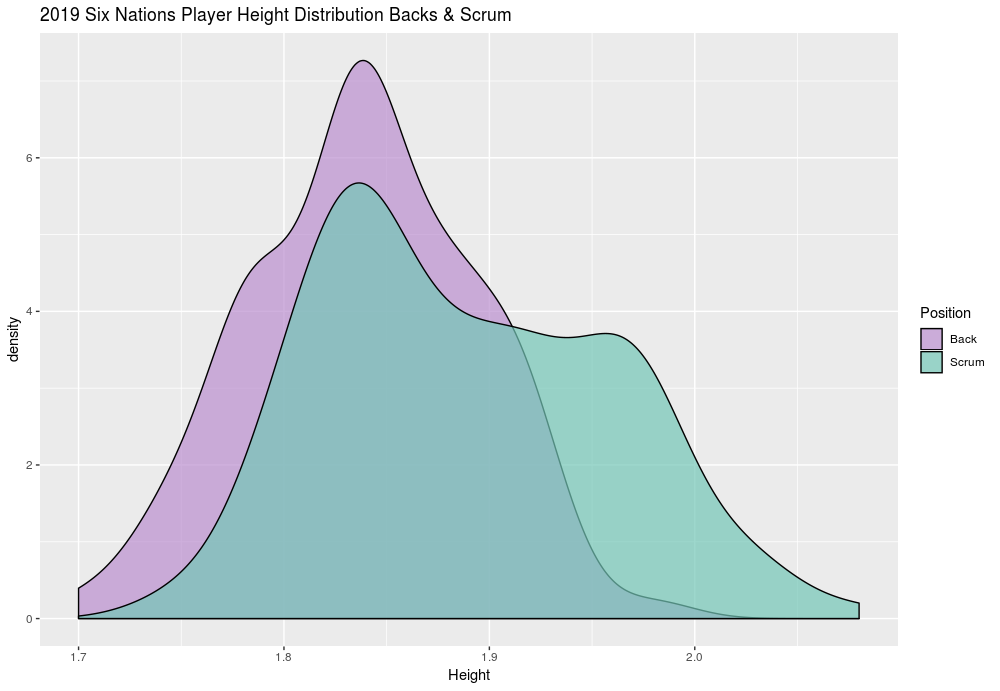
So what about player height? Below you can see some charts that map this data.

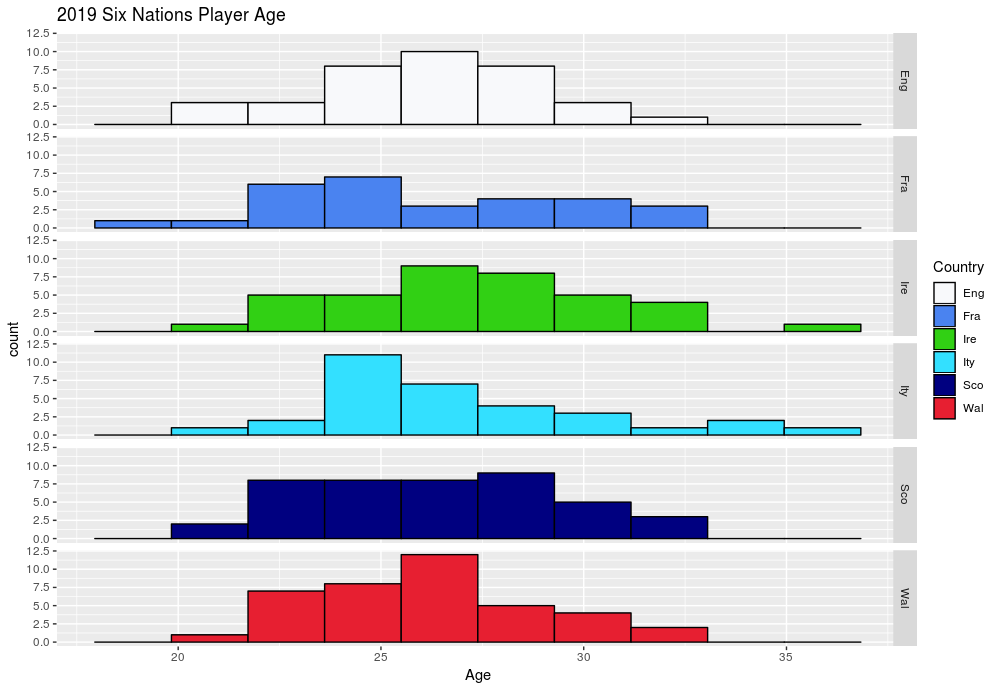
I also had a look at the age of each squad:
I’m not sure if any of the above can help predict the eventual tournament winners, but you might find it interesting reading as we eagerly await Friday night’s kick off.